
Navigating the Ocean of Data: Harnessing the Power of Knowledge Graphs in Data Catalogs

In this blog, head of the Ocean Data Platform Jo Øvstaas invites you to imagine a world where ocean data catalogs dance with knowledge graphs and AI, revealing hidden treasures of marine life with the flick of a finger, taking us on a journey to explore and protect our oceans like never before.
Ocean data catalogs
Data catalogs are critical for effective data management and decision-making. They provide a centralised repository for storing and managing large amounts of data, making it easier for users to discover and access the data they need. They also include metadata that describes data’s content, quality, and lineage. It allows organisations to better assess how reliable and relevant for their specific needs the data is. When it comes to ocean data, there are probably thousands of data catalogs on the web. Here are several of them:

Buoys are used to collect ocean data
There is clearly no shortage of ocean data, and we are seeing an exponential growth with more advanced sensors and sensor platforms that can help us collect even more data. Some examples are cube satellites, fixed-wing drones, unmanned surface vehicles (USVs), autonomous underwater vehicles (AUVs), submersibles, gliders, moored data buoys and much more.
The challenges with traditional ocean data catalogs
However, there are also some challenges with all these data catalogs.
First, many of these data catalogs are created exclusively for human interaction and not necessarily machine-to-machine communication. For this we need APIs. An API stands for "Application Programming Interface." It is a set of rules, protocols, and tools for building software and applications. Essentially, an API allows two applications (or services in the cloud) to communicate with each other, allowing one to request and receive data from the other.
In addition, each data catalog will normally cover one or several domains. The Ocean Biodiversity Information System (OBIS), which we have mentioned above, is mainly about species diversity and biodiversity. It does not say anything about domains like marine traffic, fisheries, or ocean physics. To achieve good searchability and the possibility to “fuse” different datasets together, we will need a common terminology for the metadata (or "data about the data").
The Tobis and offshore wind farms
There will usually be relationships and dependencies between different entities in a domain, as well as different domains. Let’s consider an example.
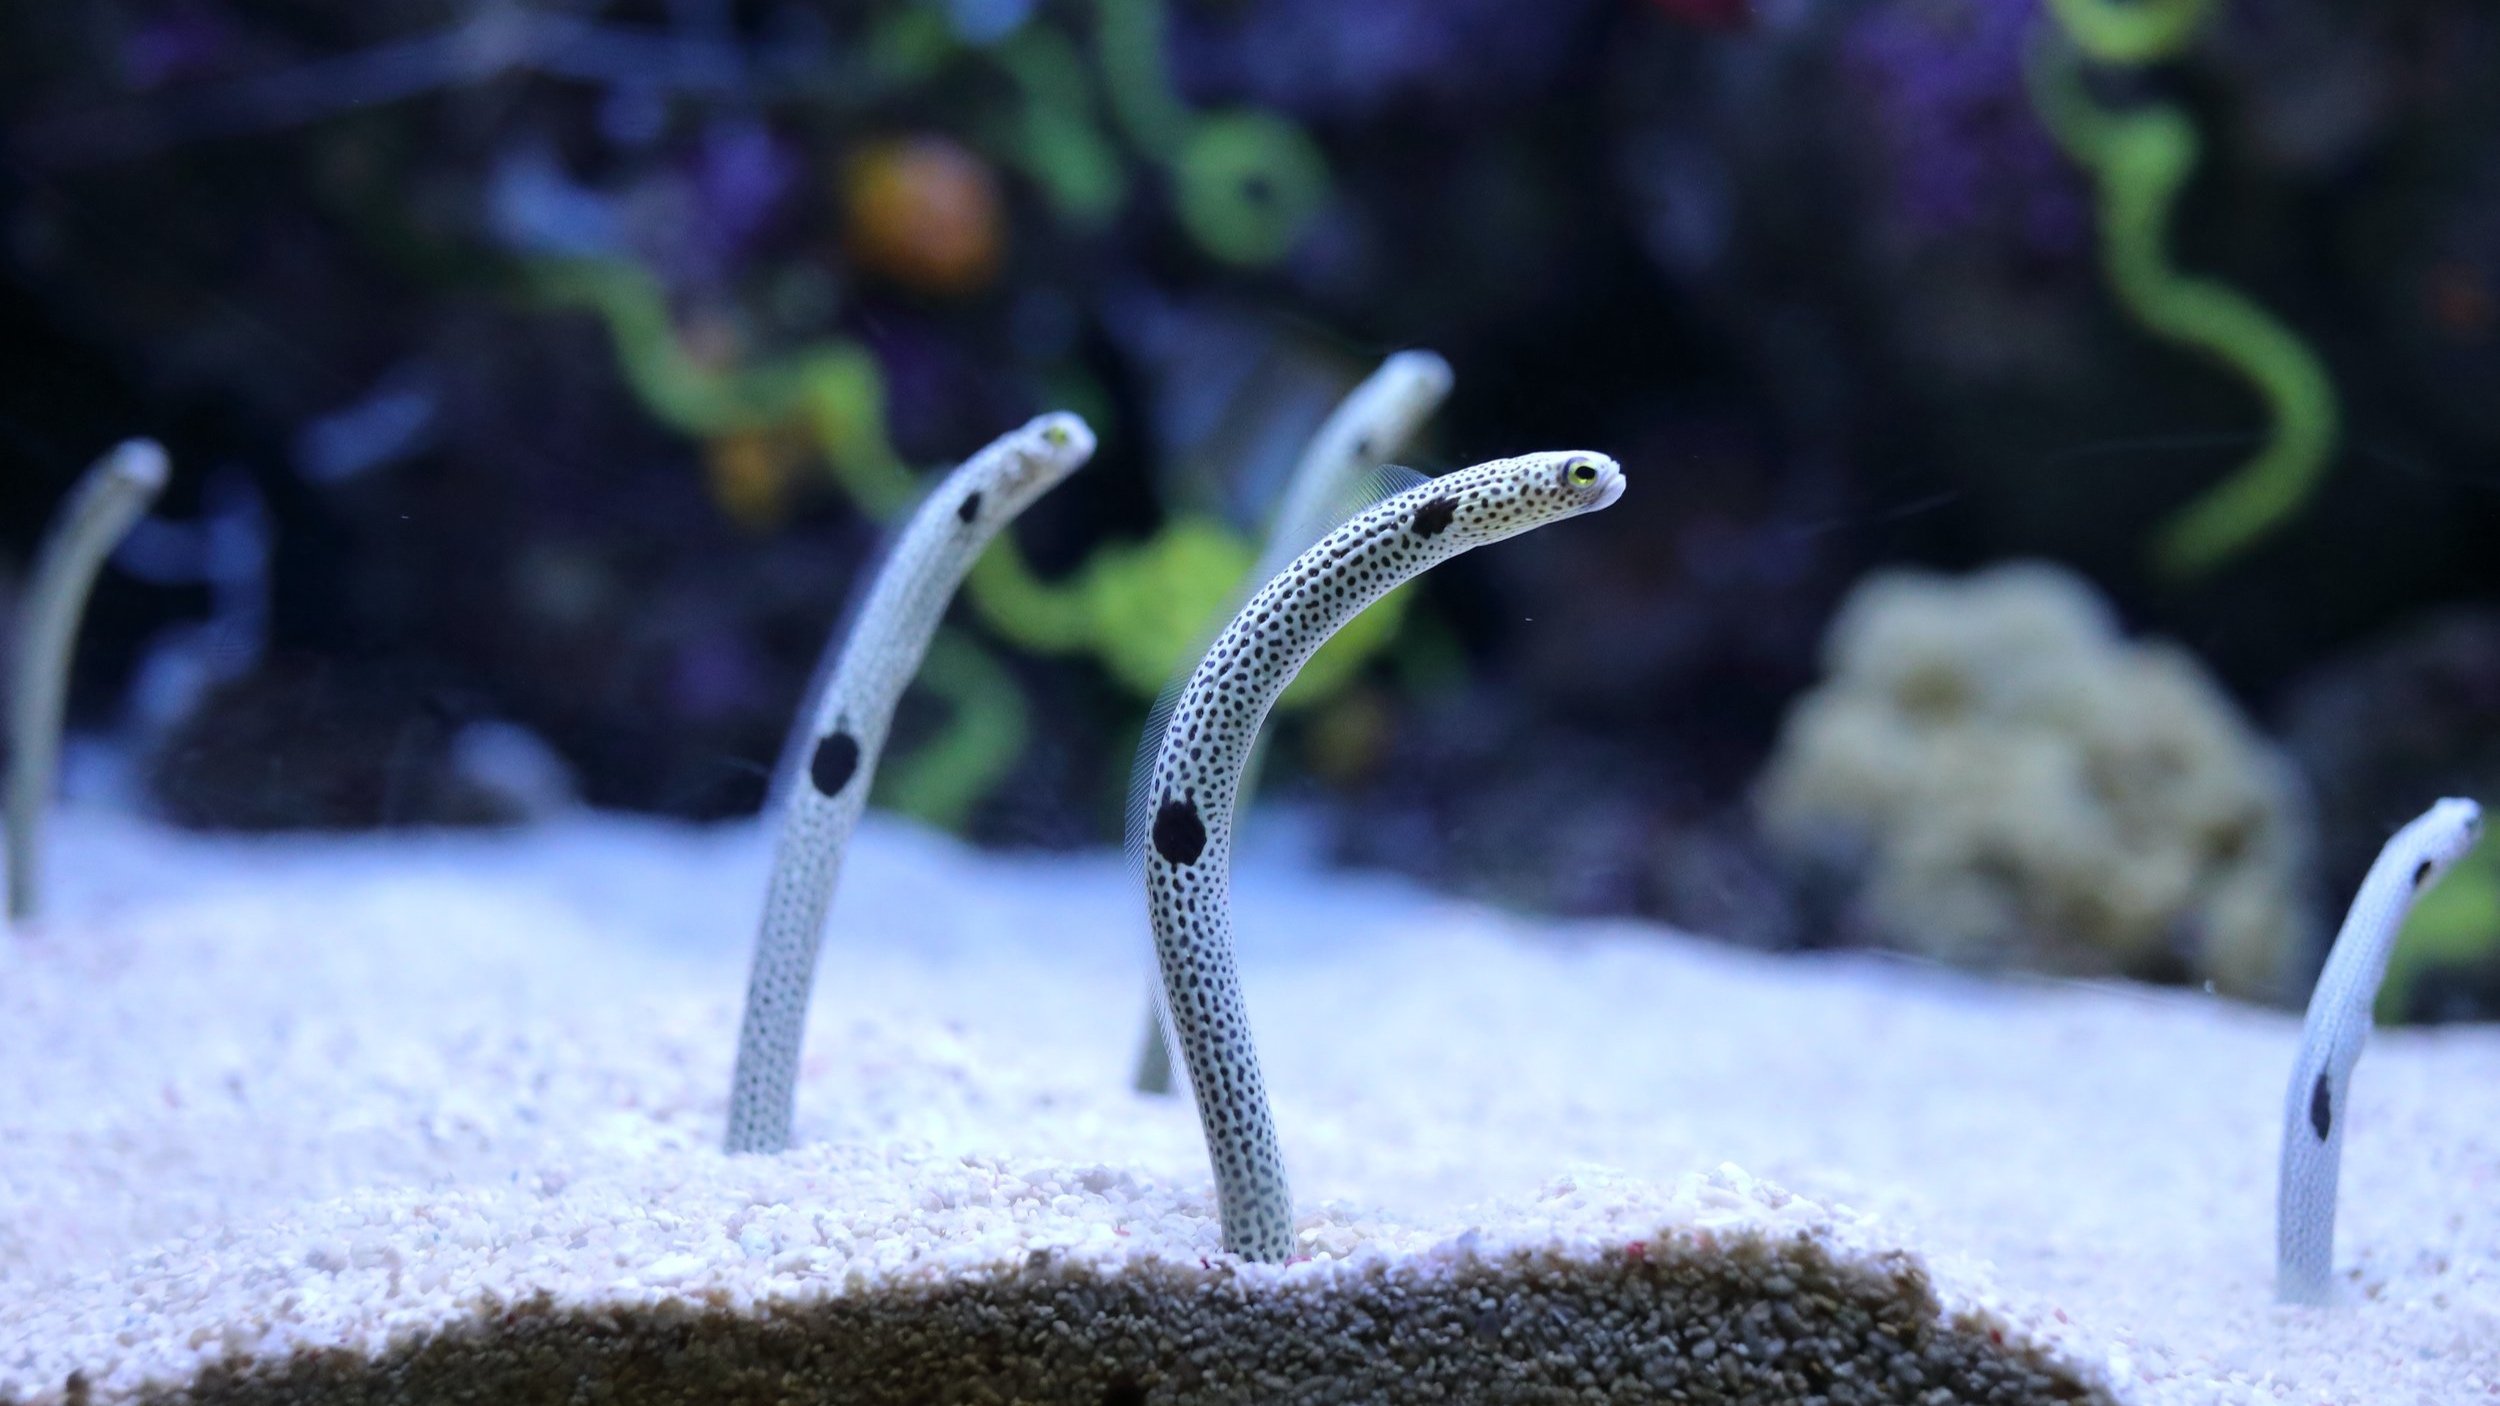
A sand eel

Ocean currents

Offshore wind farms
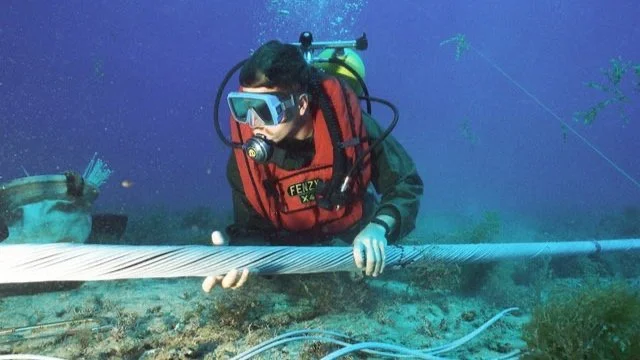
Undersea electric cables
How are they related? The sand eel A family of Ammodytidae, also known as Tobis. Found in the North Atlantic and North Pacific Oceans and characterised by their slender, elongated bodies. plays an important role in the marine food web, as they are a food source for many larger fish and marine mammals, such as seabirds, whales, and seals. On the Norwegian continental shelf, offshore wind farms are being planned, sometimes in areas where sand eels might spawn. In addition, marine scientists are concerned that fish larvae may be affected by the electromagnetic fields from submarine cables. And underwater currents will affect where the fish larvae drift.
This example may not be 100% scientifically correct, but the point is to explain entities, domains and relationships between them.
Introducing the knowledge graph
You may think of a graph as a curve drawn with an X and Y axis, but in this context we mean something else.

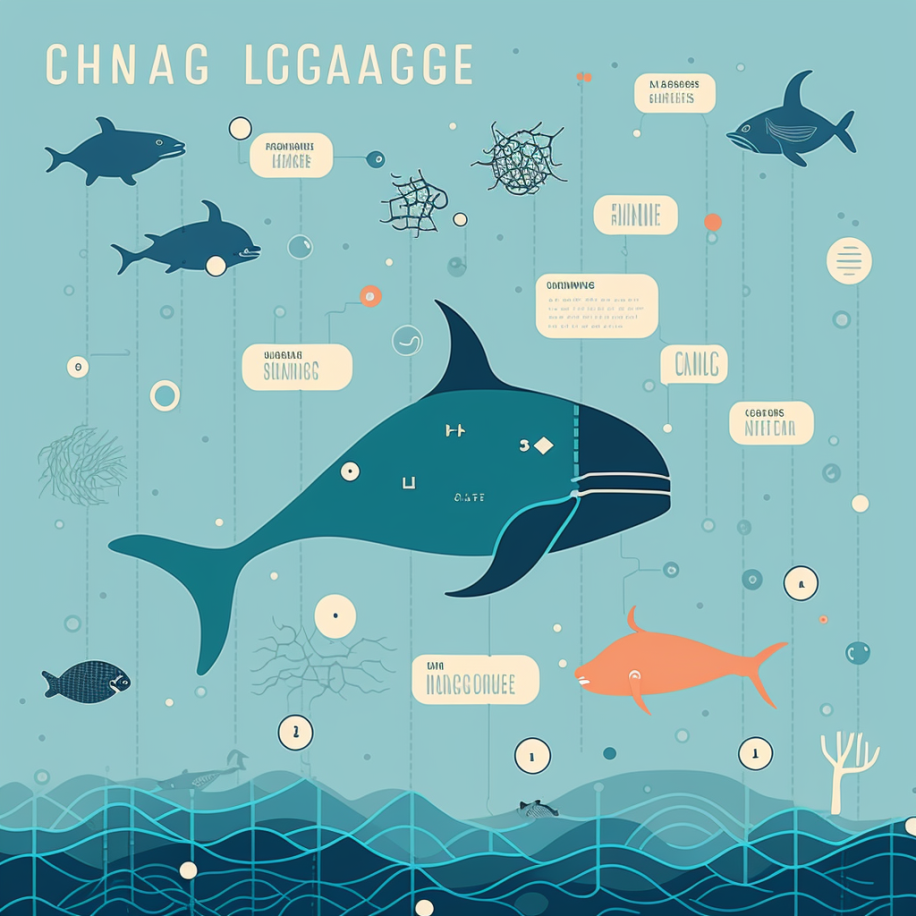
We asked Midjourney AI to represent the ocean knowledge graph to you
The first concept of a knowledge graph was introduced in the 1960s, when researchers in the field of artificial intelligence began developing methods for representing knowledge in a machine-readable form. One of the earliest forms of knowledge representation was the semantic network, which used “nodes” and “edges” to represent objects and their relationships.
Today, knowledge graphs are widely used in a variety of applications, ranging from search engines and recommendation systems to chatbots and virtual assistants. If you use LinkedIn, you use a knowledge graph behind the scenes. The same applies to the Microsoft Office graph. Nodes and edges represent things like contacts, appointments, task-lists, and emails.

We asked Midjourney AI to represent ocean knowledge graph to you
The use of knowledge graphs has become especially important in the era of big data and artificial intelligence, as they provide a way to effectively organize and manage the large amounts of data that are being generated and collected. The key advantage of knowledge graphs is their ability to capture the relationships between entities in a structured and interconnected way. This allows them to represent a wide range of information and relationships in a compact and easily understandable form. This makes knowledge graphs particularly useful for applications that require a deep understanding of the relationships between entities, such as natural language processing, machine learning, and knowledge management.
Harnessing the power of knowledge graphs in ocean data catalogs
Knowledge graphs can play a crucial role in future ocean data catalogs due to several key factors:
-
Knowledge graphs are highly interconnected, which allows them to represent complex relationships and connections between ocean data entities. This interconnectivity makes it possible to explore and understand the relationships between different ocean data entities, such as species, habitats, and oceanographic conditions.
-
Knowledge graphs are highly scalable, making them well-suited for handling large amounts of data. As ocean data continues to grow at an exponential rate, the scalability of knowledge graphs will become increasingly important in order to effectively manage and utilize this data.
-
Knowledge graphs are highly flexible, allowing for the representation of a wide range of ocean data entities and relationships. This flexibility makes it possible to incorporate new data and relationships as they become available, making the knowledge graph a dynamic and constantly evolving representation of ocean data.
-
Knowledge graphs are queryable, meaning that data can be easily retrieved and analyzed based on specific criteria. This makes it possible to easily search for and retrieve relevant ocean data entities and relationships, making it easier to understand and utilize ocean data.
-
Knowledge graphs can be integrated with AI and machine learning algorithms, enabling the creation of intelligent systems that can automatically discover relationships, make predictions, and provide insights into ocean data.
Overall, the interconnectivity, scalability, flexibility, queryability, and integration with AI and machine learning make knowledge graphs an important part of future ocean data catalogs. They provide a powerful way to represent and manage ocean data, making it more accessible and useful to researchers, policy makers, and other stakeholders.
Controlling the chaos or adapting to the chaos?
Most ocean data catalogs present things in "their" way. But what is perhaps easy to interpret for humans can be perceived as chaos by machines.
One possible way to solve this problem can be semantic technologies such as RDF. The Resource Description Framework. It is a general framework for representing interconnected data on the web. RDF is used to integrate data from multiple sources. It’s a standardised data model for representing information on the web as a graph of interconnected triples consisting of a subject, predicate, and object. But not all data catalogs expose their data as RDF.

AI has a lot of potential to take advantage of this "chaos”. A great example is Diffbot. It is a web-based platform that utilises computer vision and natural language processing algorithms to extract and structure data from web pages. It works by sending a request to a web page The platform uses a combination of techniques, including optical character recognition (OCR), natural language processing (NLP), and machine learning algorithms, to identify and extract the relevant data from web pages. For example, it can identify and extract information about products, articles, and images, as well as perform more complex tasks, such as extracting and structuring data from e-commerce sites or news articles. Once the data has been extracted and structured, it can be accessed via Diffbot's APIs, which allow developers to easily integrate the extracted data into their own applications. , analyzing the page's content, and returning structured data in a format that is easily consumable by other applications.
Large Language Models and ChatGPT
Over the last few months, we have also seen a revolution in Large Language Models (like ChatGPT) and the further democratization and accessibility of Generative AI. When it comes to ocean data, there are many possibilities with such technologies, but one of the challenges is to train the language models on very specialised (ocean) data and not necessarily "the whole internet".
In HUB Ocean we are experimenting with technologies like Langchain, which is a relatively new tool. LangChain can be used to work more efficiently with Large Language Models (LLMs). LLMs are very general in nature, which means that while they can perform many tasks effectively, they may not be able to provide specific answers to questions or tasks that require deep domain knowledge or expertise. Imagine you want to use an LLM to answer questions about a specific field, like medicine, law, or ocean governance. While the LLM may be able to answer general questions about the field, it may not be able to provide more detailed or nuanced answers that require specialized knowledge or expertise.
The vision of a world class ocean data catalog and compute infrastructure
With the right combination of smart people, a good dose of curiosity and passion, smart technologies, raw cloud power and scalable architecture, I think the following scenario should be fully possible to realise.
I come to the office (or home office) and want to do an analysis of an area where a large offshore wind farm is either planned or operated. I get a good cup of coffee and sit down in front of the voice or text interface on my PC or Mac.
If I'm an operator, I might say:
"Can you make a dynamic map view showing the daily variation in current, wind and waves for the for the Hornsea 2 offshore wind farm for the next 14 days? Also make a plot showing likely weather windows where our service vessel Windea can operate with safe margins.”
If I'm a marine biologist, I might say:
"Can you show a three-dimensional model representing the weekly estimated movement of sand eels in the Hornsea 2 area?
Nice if you also add data layers showing the seabed, habitats and water temperature. And by the way, give me 2-3 different scenarios for the different weather forecasts you have now. And one more thing, bring a data layer showing historical ship traffic in this area. And I forgot one thing. I need a chart of the position of the power cables as well.”
This would have been very exciting and timesaving to achieve. The technology, sensors and ocean process simulators are already there. It is "only" a matter of orchestrating everything and making it talk together. We shall achieve that.