
The Nord Stream gas leaks detected from cube-satellites in space

Jo Øvstaas is HUB Ocean’s Head of Platform.
A methane-sniffing satellite spotted the emissions. What can that tell us about the future on managing the ocean, using satellites, AI and machine learning? Our Head of Platform, Jo Øvstaas, discusses how the future scenarios are (almost) here.
Yesterday, pictures from the ruptured Nord Stream pipelines surfaced in the Swedish newspaper Expressen. The photos are dramatic, showing 50 meters of pipeline missing. Gone. The Danish authorities have concluded that the reason was two large explosions.
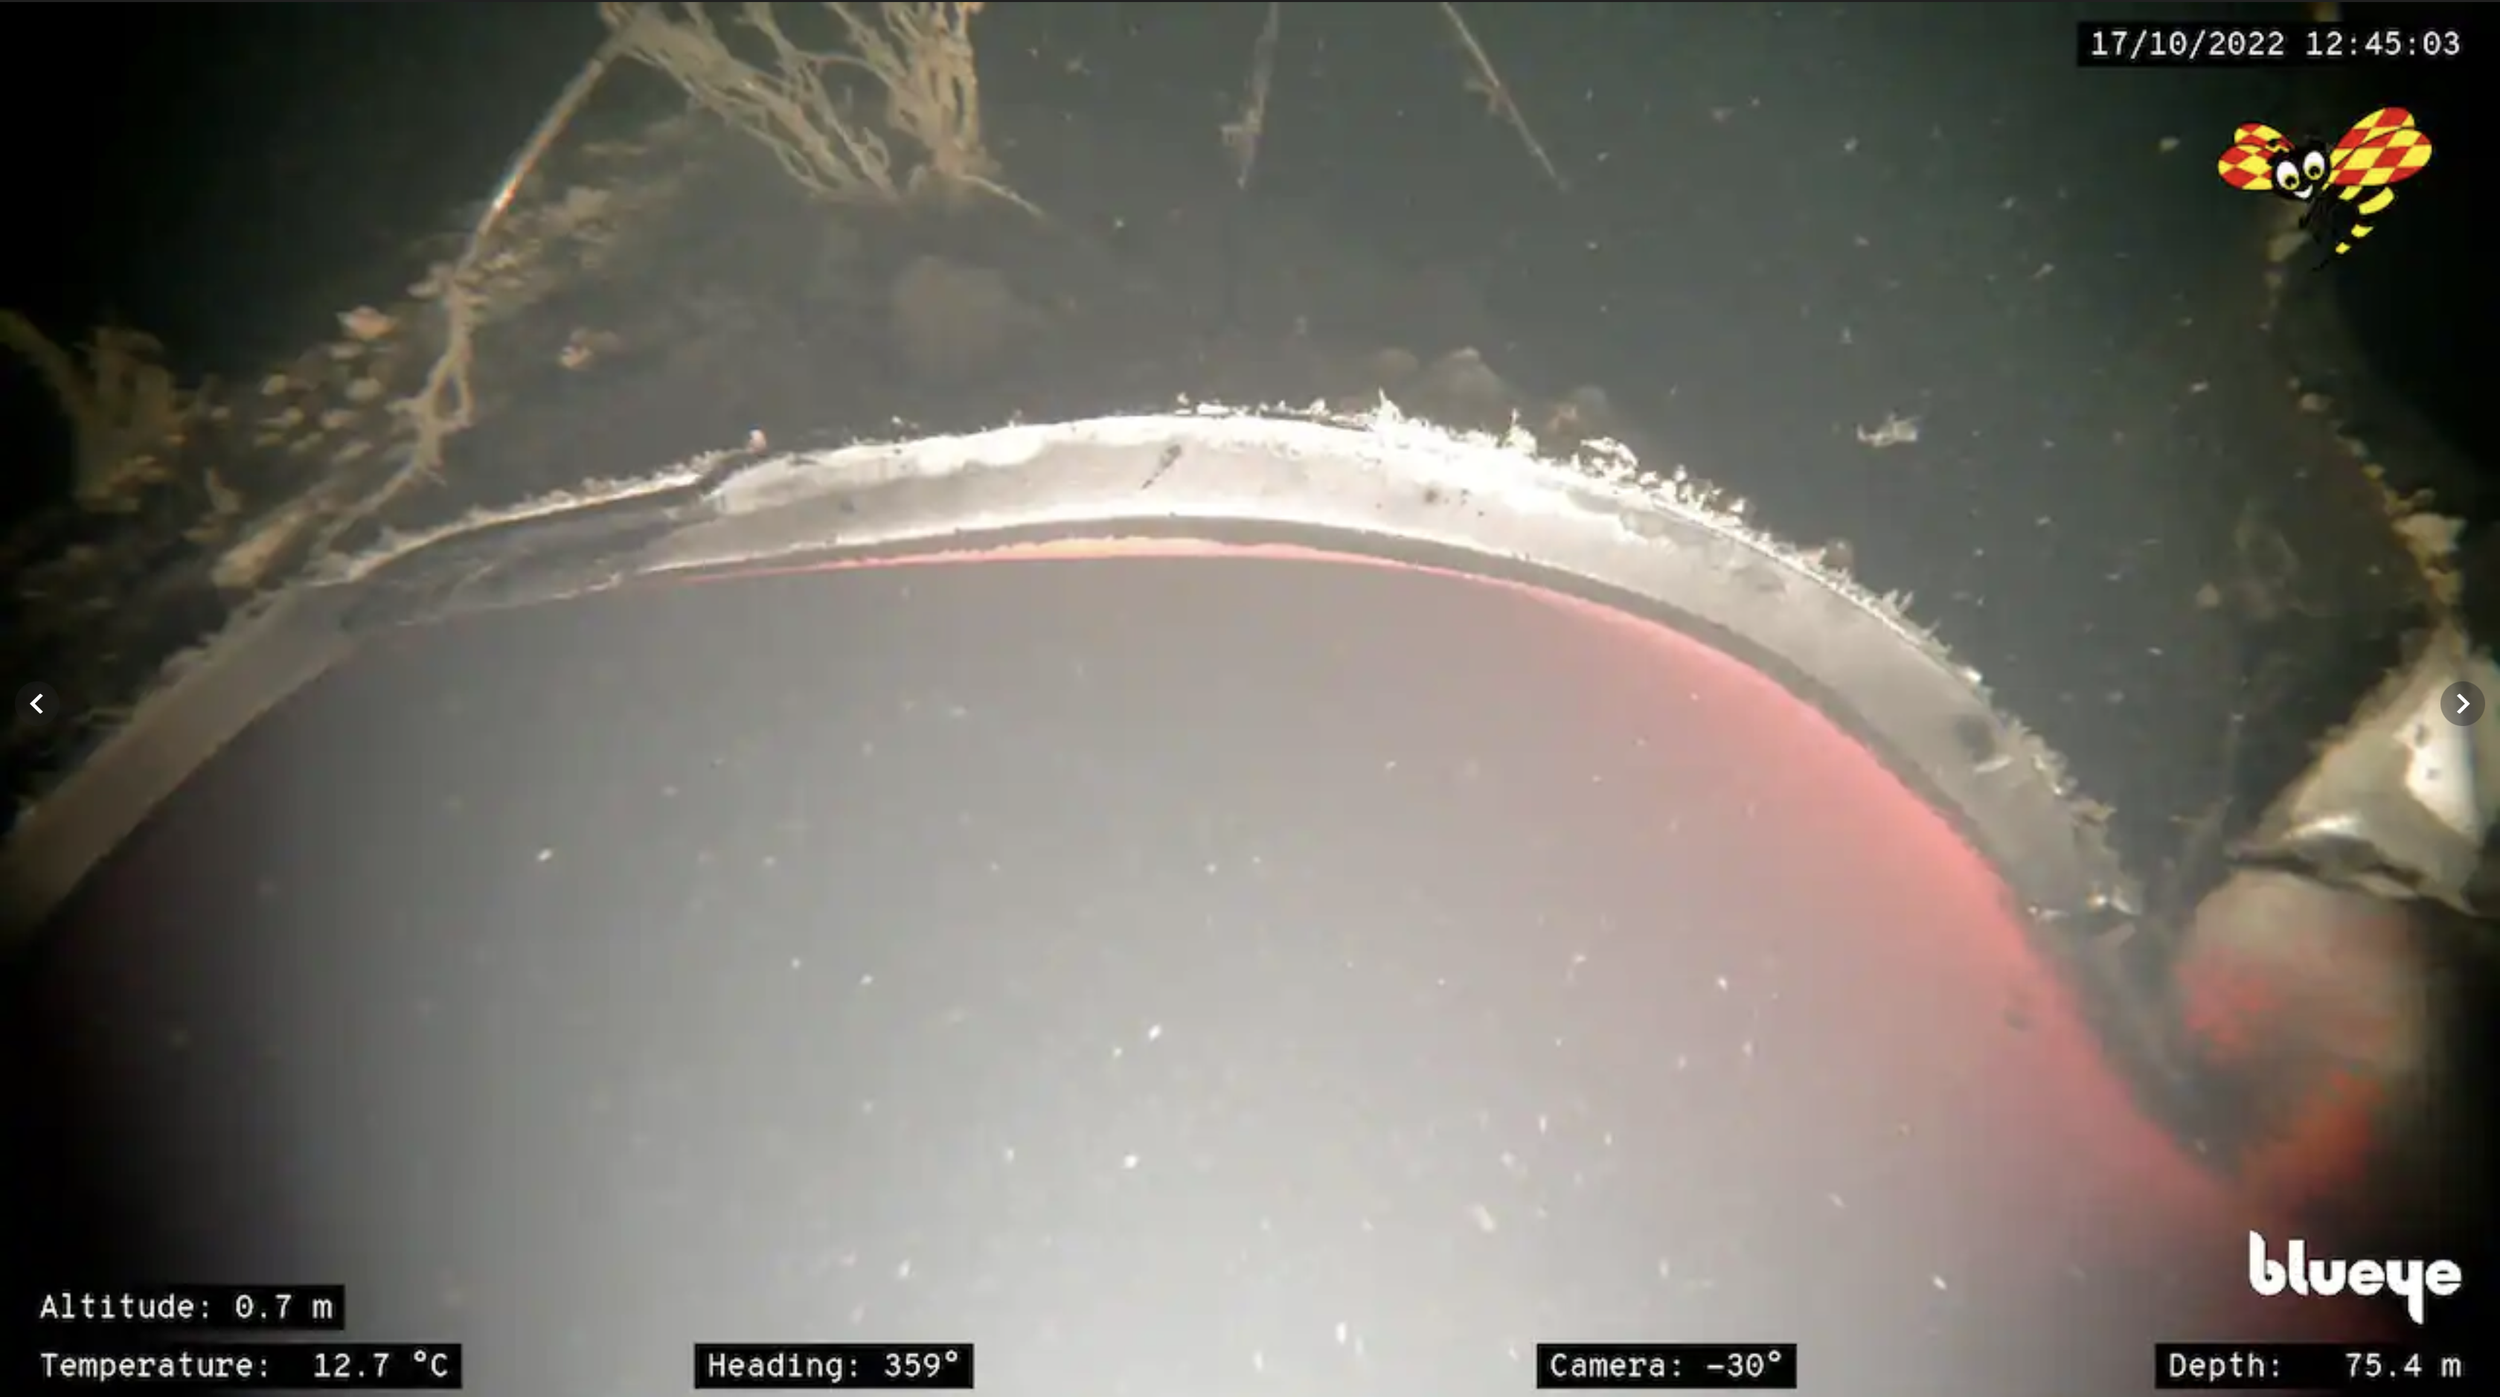
Source: Expressen/Blueye Robotics
Methane-sniffing satellites

Source: European Space Agency/GHGSat
Let us rewind to September 26th, when the two gas pipelines Nord Stream ruptured in four places. The damaged pipelines discharged vast amounts of methane, a potent greenhouse gas, into the air for several days before becoming empty.
Thousands of miles away, a "methane-sniffing" satellite picked up on the emissions.
The Dove CubeSat, operated by San Francisco-based Planet, spotted methane being released onto the surface of the Baltic Sea. Planet currently operates a fleet of about 200 Doves, each about the size of a shoebox but capable of separating objects up to 3 meters (10 feet) on the Earth's surface.
This happened a short time after The Geological Survey of Denmark and similar organizations in Germany, Sweden, Finland and Norway could see spikes on their seismographs. Data showed that the tremors had happened near the locations where the leaks were later discovered. Around the same time, pressure losses in the pipelines were recorded in Germany.
Although Dove-satellites primarily have optical sensors, there is also a growing amount of methane-sniffing satellites in operation.

Planet Labs Dove CubeSat captured an image of the Nord Stream Gas pipeline rupture. Source: Planet labs
“Eyes in space” picking up on ocean conditions
Satellites allow scientists to see large ocean areas simultaneously as they orbit Earth. With such advanced sensor platforms, our "eyes in space" can see different aspects of ocean conditions such as sea surface temperature, chlorophyll levels (which show phytoplankton amounts), mangroves, coral reefs, seabed habitats or oceanic currents.
We can also see various human activities like fishing, shipping, oil and gas infrastructure, and offshore wind or aquaculture farms. And on top of this, we can, through the ocean-internet-of-things and big data analytics, derive data products like ship emissions on a macro and micro scale (see our ship emission solution for reference).
Our planet constantly changes in ways that impact every facet of our society. To keep coastal communities, economies, and ecosystems healthy requires keeping track of ocean and coastal areas—monitoring and assessing how these areas are changing.
From tracking nutrient pollution, assessing climate change, measuring sea-level rise, or surveying the coastline and seabed, physical, chemical, and biological observations help policymakers, industries, scientists, and NGOs make the best environmental decisions.
Luckily, our ability to remote and in-situ ocean monitoring has grown significantly during the past two decades. The so-called 4th industrial technologies have caused an explosion in new data about the ocean and are reshaping how we understand and manage the ocean.

Scientists sometimes refer to this as the "observational pyramid". The pyramid consists of everything from small satellites to aerial drones, autonomous surface vessels (SUVs), sail drones, data buoys, gliders, autonomous underwater vehicles (AUVs) and seabed observatories.
Although satellites cannot "see" that far down into the water column, they have the obvious advantage that they can cover huge areas in a short time. A research vessel may manage to cover an area of 1000 km2/hour, while a satellite can cover up to 4 million km2/hour.
A more transparent and efficient ocean management
When we compile all the data streams from this observational pyramid, we manage to create fairly accurate simulation models. In fact, our scientists have already been doing this for a while. You might already have heard about things like WRF (Weather Research and Forecasting model) and ROMS (Regional Ocean Modeling System)? Anyhow, it's up to everyone to take advantage of even faster data streams, harmonizing data and "automatic" tuning of such simulation models.
Imagine the following scenario:
A satellite "sniffs" an anomaly, for instance, abnormal concentrations of methane gas, and trigger an alarm/notification about this incident
A drone flies out autonomously to examine and confirm the incident both above and below the water
The newly collected data triggers new simulations that can help us (humans) make better decisions even faster
This is not a future scenario. It's (almost) here now. And it enables us to achieve an even more transparent and efficient ocean management.